What Does ‘Food Equity’ Look Like in Your Neighborhood?
A nutritious diet is essential for good health. But many vulnerable populations, such as Latinos, struggle to access and afford healthy food.
To help, we need to know where to start.
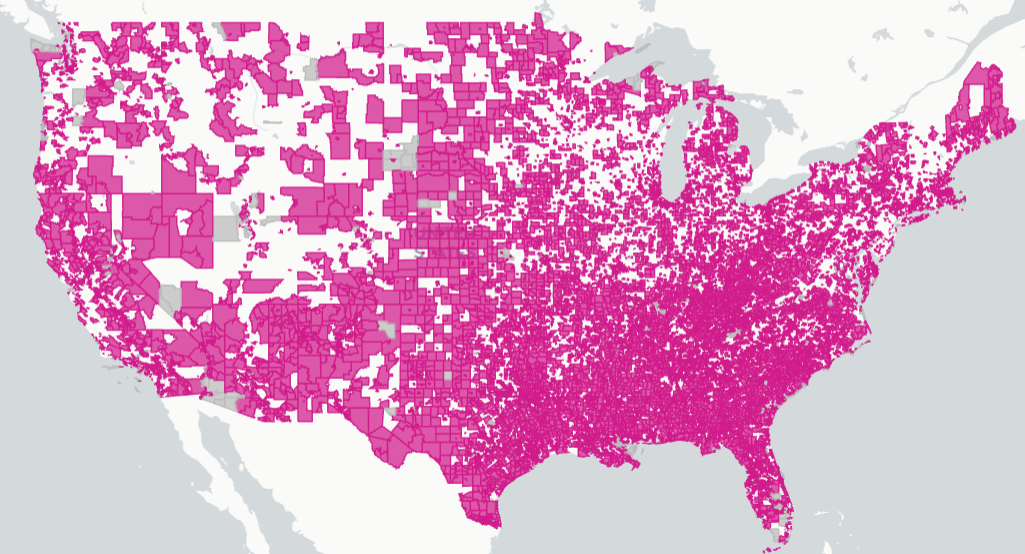
Fortunately, a new tool, the Food Equity Opportunity Map, highlights healthy food access issues across the country to show where improving access would make the greatest impact.
“Together, we can build community health through improving Food Equity, but only if we first understand where that work is most needed. That’s why we launched the Food Equity Opportunity Map,” according to the creators of the map, Partnership for a Healthier America (PHA), a national nonprofit organization focused on health equity, and the University of Maryland Baltimore County.
Mapping Food Equity and Food Access
To develop the Food Equity Opportunity Map, researchers analyzed regions nationwide on a community-by-community level.
They evaluated residents’ access to good food, ability to afford good food, consumption of good food, and rates of Type II diabetes, a preventable disease prevalent in Latinos and closely linked to poor nutrition.
Researchers defined good food as “nourishing, high-quality produce, such as vegetables, fruits, beans, and nuts,” according to a press release.
Researchers then created the map, which reveals the percentage of households living below the poverty line, percentage of households with low food access, and percentage of adults diagnosed with Type II diabetes in communities across the nation.

Pink areas = food equity opportunity areas
The Importance of the Food Equity Opportunity Map
PHA hopes the Food Equity Opportunity Map can help identify where improvements to food equity are most needed.
The map can also aid in addressing the nationwide nutrition gap, a key focus area of the Biden administration.
“Food is the number one driver of good health, and in too many places, good food is either too expensive, too far away, or both,” Noreen Springstead, President & CEO of PHA, said in a press release.
“By identifying the regions with the greatest need for improvements in food access, we’re taking the first steps in building community health and ensuring that every person has equitable access to healthy and affordable food options.”
Latinos and Food Insecurity
Latinos nationwide struggle with poverty and food insecurity, but these disparities are especially present in the southern US, including Texas, which has a 40.2% Latino population.
Texas’ major cities, including San Antonio, Houston, Dallas/Fort Worth, and Austin are hot beds for communities with low food access, according to the map.
The Rio Grande Valley, which is known for its food deserts, shows similar trends.
In fact, much of Texas’ communities are graded as “Food Equity Opportunity Areas,” meaning these communities could benefit from opportunities to increase food access.
The rise in demand at Texas food banks supports this data, as families struggle to put food on the table amid inflation and the end to pandemic-era SNAP benefits.

Implications of Low Food Access
Unfortunately, food insecurity is associated with obesity and a slew of other diseases, like heart disease and diabetes, as consumers with strict food budgets are often understandably attracted to cheaper, less healthy food.
Considering Latinos face a variety of other health disparities, such as lack of health insurance and access to safe places to exercise, food insecurity adds another layer of complexity to improving Latino health.
“Latinos are disproportionately affected by food insecurity and are more likely to face barriers to affordable healthy food,” said Dr. Amelie Ramirez, director of Salud America! and its home base, the Institute for Health Promotion Research at UT Health San Antonio. “Health policies must work toward addressing these barriers to food equity, including lack of grocery stores and farmer’s markets within walkable range. Increasing access to public transportation and food delivery services can also help Latinos and other people of color maintain a nutritious diet and lessen their risk for diet-associated diseases.”
Future Ideas for the Food Equity Opportunity Map
PHA already has plans for updating and improving the map in the future, according to their website.
Future updates to the map include:
- Food Equity Bright Spots: Amazing work is changing the food system. Future versions of the map will include these stories of change.
- PHA partners: Over 490 partners nationwide are working to improve food equity. These partners will be added to the map.
- Food purchasing habits: Food purchasing behavior could help map users understand consumption patterns at a deeper level.
- Transportation: One of the key factors affecting food accessibility is the ability to get to food stores. Families living in communities that have limited public transportation face greater challenges to food security.
If you have ideas on other information you’d like to see on the Food Equity Opportunity Map, please contact the developers.
Get Involved in Improving Health Equity
In addition to the new Food Equity Opportunity Map, you also can find out what food security and nutrition look like in your county using Salud America’s Health Equity Report Card!
Select your county and see details regarding food and nutrition including:
- food access
- percentage of population with SNAP Benefits
- grocery store rate
The Health Equity Report Card also can help you identify local inequities in housing, transportation, education, and much more.
Email your Health Equity Report Card to community leaders, share it on social media, and use it to make a case to address food access and health equity where help is needed most!
Get your Health Equity Report Card!
The post What Does ‘Food Equity’ Look Like in Your Neighborhood? appeared first on Salud America.

